 PaisaOrbit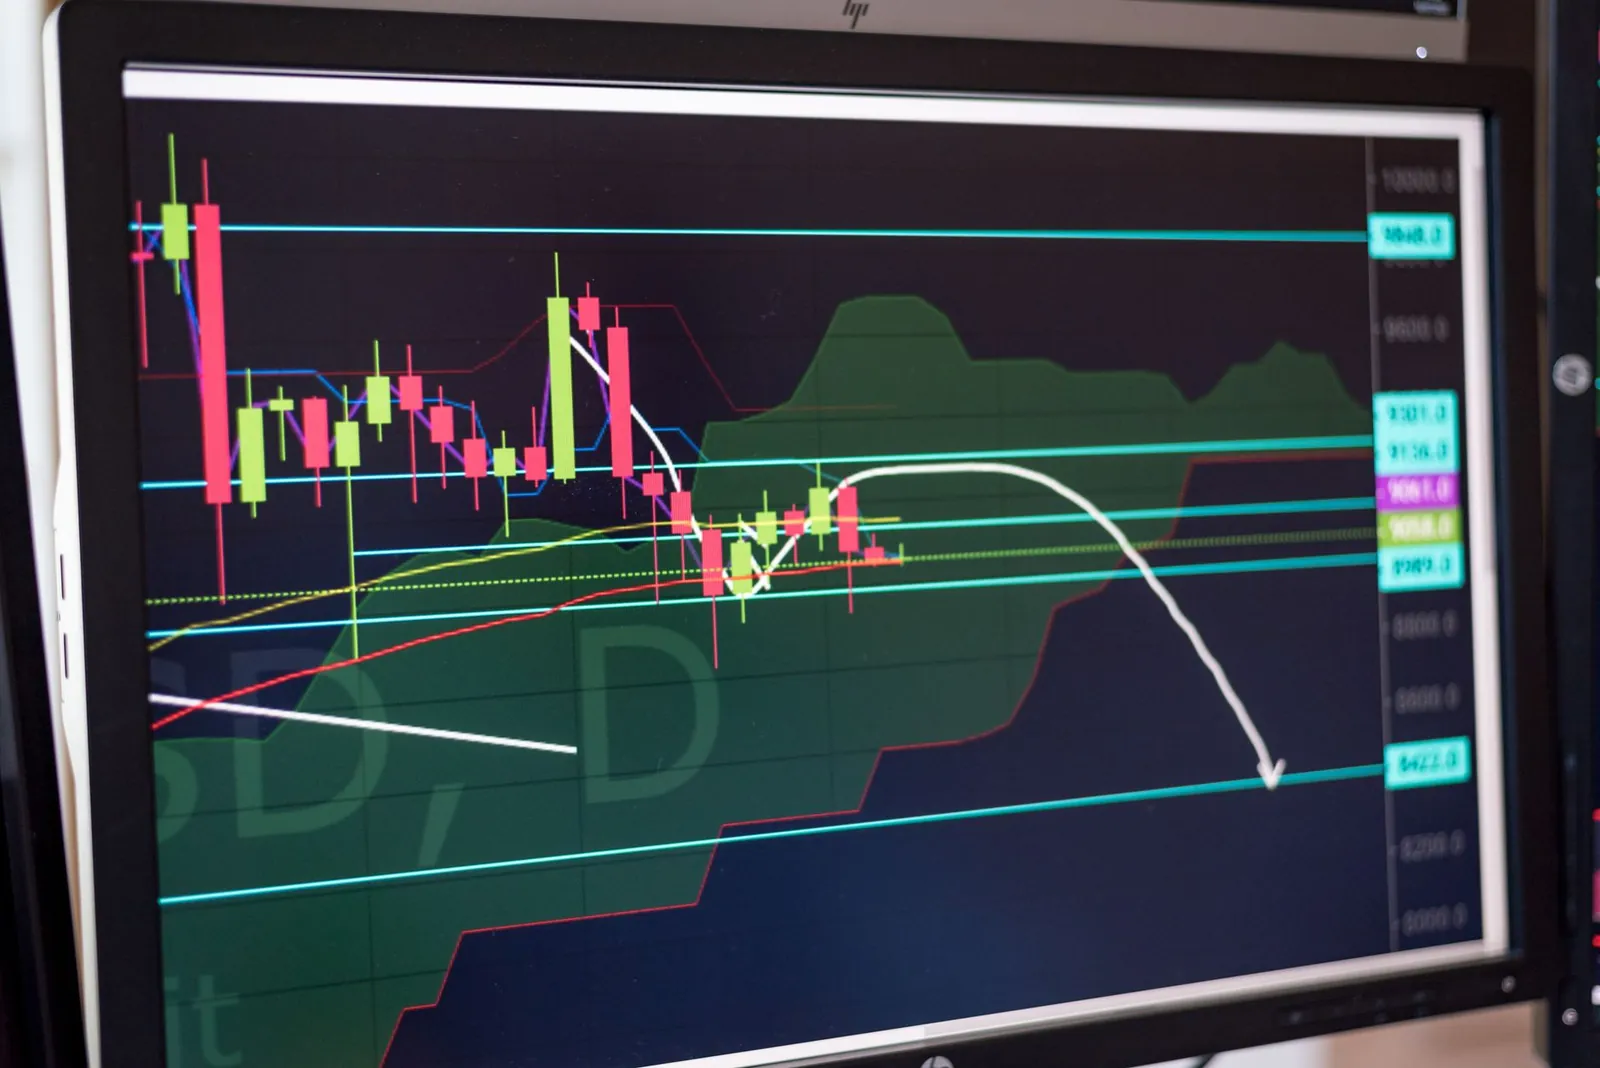
Every candlestick chart you look at, whether it is Nifty 50, Reliance Industries, or a small-cap stock, tends to move within an invisible corridor. Prices rise, then stall. They fall, then bounce back. The two "walls" of that corridor are known as support and resistance — arguably the most widely used concept in technical analysis, and the foundation almost every other charting tool is built on top of.
This guide breaks down what support and resistance actually are, how to identify them on a real chart, why they work, and how traders use them to plan entries, exits, and stop-losses — with worked numbers, not just theory.
What Are Support and Resistance?
Support and resistance (often shortened to "S&R") are specific price levels on a chart where the price has repeatedly struggled to move beyond, because buying or selling pressure builds up at that point.
| Aspect | Support | Resistance |
|---|---|---|
| Position vs. current price | Below the market price | Above the market price |
| Dominant force | Demand > Supply | Supply > Demand |
| Typical trader action | Buying / long entries | Profit-booking / short entries |
| Visual cue on chart | Price bounces up off the line | Price gets pushed back down |
| Acts as a trigger to | Buy | Sell |
| After a confirmed break | Becomes new resistance | Becomes new support |
In simple terms: if the current market price is below a level, that level acts as resistance; if the current price is above a level, that same level acts as support. The two are the same phenomenon viewed from opposite sides of the price.

Why Do Support and Resistance Levels Work?
Support and resistance are not physical barriers — they exist because of collective trader psychology and memory:
- Anchoring bias: Traders remember the price at which a stock previously reversed and place fresh buy/sell orders around the same zone.
- Round numbers: Prices like ₹100, ₹500, or ₹1,000 attract disproportionate buying/selling simply because they're psychologically "clean" levels.
- Order clustering: Stop-loss orders, pending limit orders, and institutional buy/sell programs bunch up near prior highs and lows, creating a genuine wall of supply or demand.
- Self-fulfilling prophecy: Because so many participants watch the same levels, a large number of them acting on the same signal reinforces the very reversal they expected.
How to Identify Support and Resistance on a Chart
Spotting S&R is a visual exercise, but it follows a repeatable, five-step process:
| Step | Action | Data window |
|---|---|---|
| 1 | Load enough price history | Short-term: 3–6 months · Long-term: 12–18 months |
| 2 | Spot "price-action zones" — hesitation after a move, or a sharp reversal | — |
| 3 | Confirm at least 3 touches at roughly the same price, well spaced in time | — |
| 4 | Draw a horizontal line connecting those touches | — |
| 5 | Treat the line as a zone, not a single price | Typical width: ±1–2% of the level |

Worked Examples: Turning a Level Into a Trade Plan
Here's how the same five steps translate into an actual entry, stop-loss, and target — one short trade built on support, one long trade built on resistance:
| Trade | Entry | Stop-loss | Target (S/R level) | Risk | Reward | Risk : Reward |
|---|---|---|---|---|---|---|
| Short (resistance faded) | ₹442 | ₹446 (+0.9%) | ₹435 support (−1.6%) | ₹4 | ₹7 | 1 : 1.75 |
| Long (support bought) | ₹206 | ₹202 (−1.9%) | ₹215 resistance (+4.4%) | ₹4 | ₹9 | 1 : 2.25 |
In the short trade, the stock had repeatedly failed near ₹215 and was shorted lower down at ₹442 against a nearby swing high of ₹446, targeting the ₹435 support zone where buyers had shown up three times before. In the long trade, price was bought at ₹206 with a stop just under a recent low of ₹202, targeting the ₹215 resistance — the same level that had capped rallies in the past. Notice both setups clear a 1:1.75+ risk-to-reward, which is the real reason traders anchor targets to S&R levels instead of picking numbers at random.
What Happens When Support or Resistance Breaks?
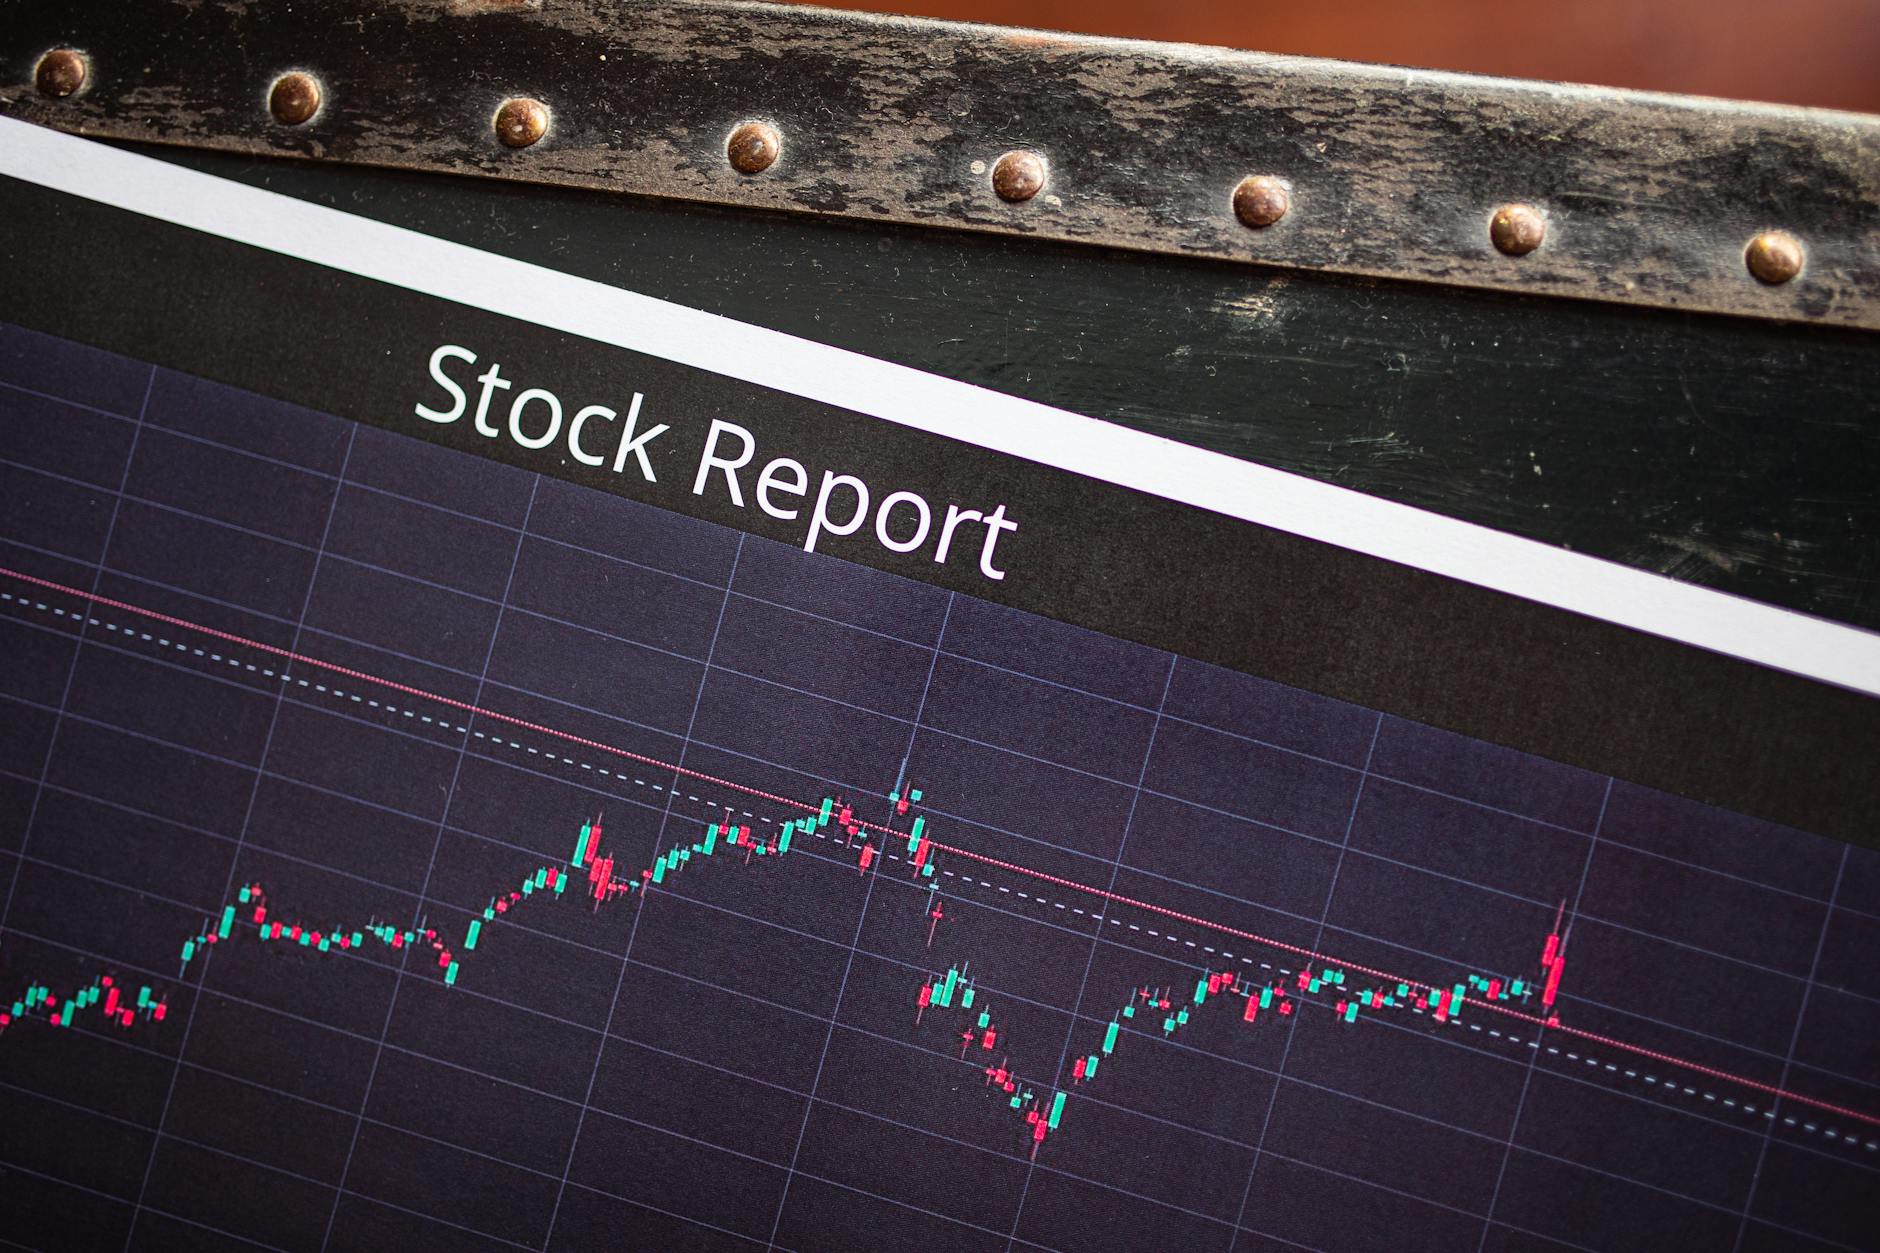
When enough buying or selling pressure overwhelms a level, price breaks through it — and role reversal follows: a decisively broken resistance (confirmed by strong volume and a close beyond the level, not just an intraday wick) tends to become the new support on the next pullback, and vice versa for broken support. This "breakout and retest" pattern is one of the most reliably traded setups in technical analysis, because it combines a fresh trend signal with a lower-risk re-entry point.
Tools That Sharpen Support and Resistance
| Tool | Type | What it adds |
|---|---|---|
| Moving averages (20/50/200-day) | Dynamic | Trails the trend instead of sitting at a fixed price |
| Trendlines | Diagonal | Connects swing highs/lows through a trending market |
| Fibonacci retracement | Ratio-based | Projects likely reaction zones during a pullback |
| Volume profile | Volume-based | Flags price zones with the heaviest historical trading |
| Round numbers | Psychological | ₹100 / ₹500 / ₹1,000-style levels traders anchor to |
Fibonacci retracement in particular is worth knowing by its actual ratios, since these specific percentages recur across almost every charting platform:
| Level | Ratio | Typical read |
|---|---|---|
| 23.6% | Shallow pullback | Strong trend, continuation likely |
| 38.2% | Common pullback | First real test of trend strength |
| 50.0% | Psychological midpoint | Not a true Fibonacci ratio, but widely watched anyway |
| 61.8% | "Golden ratio" pullback | Last realistic stand before the trend is in question |
| 78.6% | Deep pullback | Near-full retracement; trend likely broken |
Common Mistakes to Avoid
| Mistake | Why it hurts | Fix |
|---|---|---|
| Treating a level as an exact price | Gets stopped out on ordinary noise | Trade the zone (±1–2%), not one number |
| Ignoring volume on a breakout | Low-volume breaks reverse fast ("fakeouts") | Confirm with volume and a close beyond the level |
| Using too few touchpoints | One or two reactions don't make a level reliable | Require at least 3 touches, well spaced in time |
| Fighting a confirmed breakout | Betting against a fresh trend | Wait for the retest instead of fading the move |
Key Takeaways
- Support is a price floor where buying pressure tends to outweigh selling; resistance is a price ceiling where selling pressure tends to outweigh buying.
- A reliable level needs at least 3 well-spaced touchpoints and is best traded as a ±1–2% zone, not a single price.
- Anchoring stop-loss and target to S&R levels is what produces workable risk:reward ratios — both worked examples above clear 1:1.75 or better.
- When broken on strong volume, support and resistance swap roles — old resistance becomes new support, and vice versa.
- Layering in moving averages, trendlines, Fibonacci ratios, and volume profile turns a basic horizontal line into a much higher-confidence read.
Support and resistance won't predict the market with certainty — nothing does — but understanding these zones gives traders and investors a structured way to plan entries, set realistic targets, and place stop-losses where the risk-to-reward actually makes sense. It remains, even decades after being first popularised, one of the simplest and most durable tools in a trader's kit.