 PaisaOrbit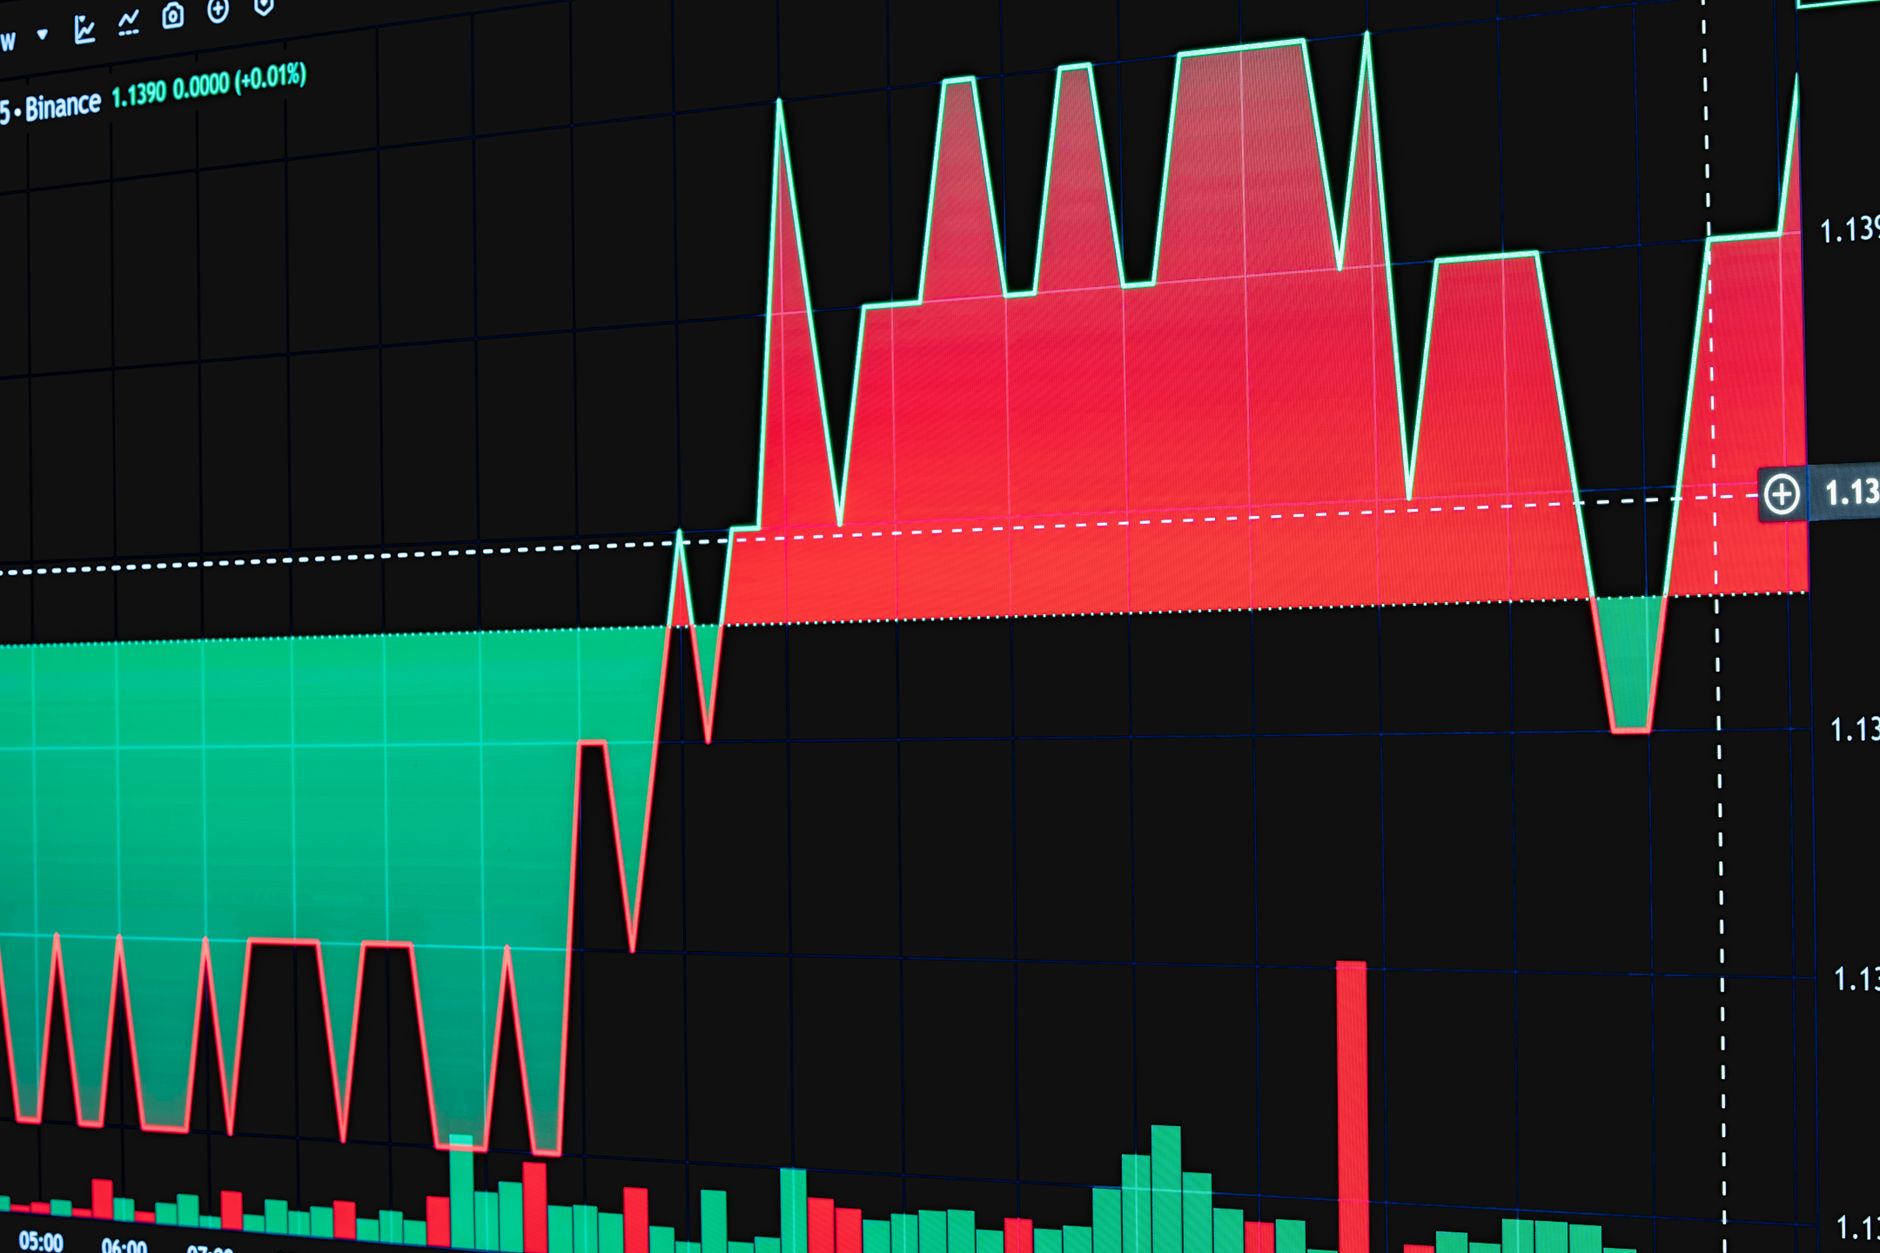
Ask any experienced trader what they check right after a stock's Last Traded Price (LTP), and most will say the same thing: volume. LTP tells you where a stock is trading right now, but on its own it can't tell you whether that price is meaningful or just noise. Volume — the number of shares changing hands — is what tells you how much conviction is behind the move. Read together, the two form one of the most reliable, easy-to-use signals in technical analysis.

What LTP and Volume Actually Measure
LTP (Last Traded Price) is simply the price at which the most recent trade in a stock was executed. It updates continuously through the trading session and is what you see flashing on a broker's terminal or a stock ticker.
Volume is the total number of shares (or, for an index, the total value) traded during a given period — a minute, an hour, or a full session. It measures participation: how many buyers and sellers were active enough to actually transact, not just watch.
Neither number means much in isolation. A price can move on a single large trade with almost no real support behind it, or it can hold steady while enormous volume quietly changes hands underneath. It's the relationship between the two that reveals what's really happening.
Why Volume Confirms — or Contradicts — a Price Move
Price shows direction; volume shows strength of conviction. When a stock's LTP moves up or down on rising, above-average volume, it means a large number of participants agree with that move — buyers are aggressively bidding it up, or sellers are aggressively dumping it. That kind of move tends to have follow-through.
When the same price move happens on thin, below-average volume, it's a warning sign. Few people are actually behind the move, which means it can reverse just as quickly as it appeared. This is why traders often say a breakout or breakdown "needs volume to be trusted": a stock's LTP punching through a resistance or support level on heavy volume is considered a far more reliable signal than the same breakout on light volume.

The Eight Price-Volume Scenarios
Technical analysts commonly map LTP and volume behavior into eight combinations, each hinting at a different phase of a trend:
- Volume up, price up — a bullish signal; buyers are firmly in control.
- Volume up, price down — heavy selling, but can also mark capitulation near a bottom.
- Volume up, price flat — a tug-of-war between buyers and sellers; often precedes a breakout in either direction.
- Volume down, price up — an uptrend running out of fuel; treat new highs here with caution.
- Volume down, price down — a weakening downtrend, sometimes the calm before a bounce.
- Volume down, price flat — low interest and indecision; the market is waiting for a catalyst.
- Volume flat, price up — a steady, sustainable uptrend with no sudden excess.
- Volume flat, price down — a long, grinding bearish trend with no sign of relief yet.
No single scenario guarantees an outcome, but together they give traders a quick way to gauge whether an LTP move is backed by real participation or just drifting on light interest.
Reading LTP and Volume Together in Practice
In practice, this pairing is used most often around two situations:
- Breakouts and breakdowns. When a stock's LTP crosses a well-known resistance or support level, checking whether volume spiked at the same time tells you whether the move is likely to hold or fade back.
- Trend confirmation. A sustained uptrend accompanied by steadily rising volume suggests genuine accumulation by buyers. If volume dries up while price keeps climbing, it's often a sign the rally is thinning out and due for a pause or reversal.
Neither LTP nor volume should be read alone. A price spike with no volume behind it is easy to dismiss; a volume spike with no price movement is worth watching closely, since it often means big positions are being built quietly before the price catches up. Used together, the two remain one of the simplest and most effective tools for separating a real move from noise.